California imports about a quarter of its electricity despite leading on solar PV
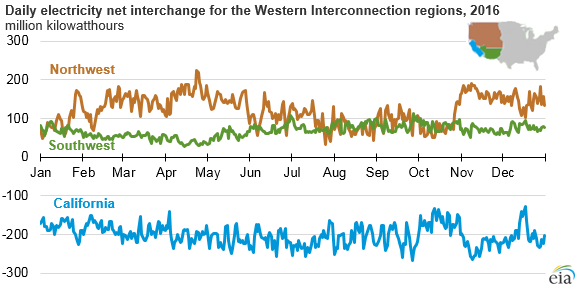
Source: U.S. Energy Information Administration, U.S. Electric System Operating Data Note: Net interchange values are aggregates of reported metered flow values on transmission tie lines between balancing authorities. California.
Survey includes data from all 66 electric system balancing authorities that make up the Lower 48 electric grid
In 2016, the California Independent Systems Operator (ISO), which coordinates most of the electricity used in California, imported a net daily average of 201 billion kilowatthours (kWh) throughout the year from other western regions, or about 26 per cent of its average daily demand.
Those imports were supplied by the other two regions that make up the Western Interconnect (WECC). The Northwest region of WECC, which includes most of Colorado, Idaho, Nevada, Montana, Oregon, Utah, Wyoming, Washington, and a small area of northern California, supplied a daily average of 122 billion kWh.

The bulk of the remaining imports to the California ISO, 68 billion kWh per day on average, came from the Southwest region of WECC, which includes much of Arizona, New Mexico, and small portions of Nevada and Texas.
Daily net interchange values reflect the sum of hourly electricity flows on transmission lines between the balancing authorities that manage regional electric production and consumption.
Despite net daily imports, on an hourly basis, the California ISO sometimes exports electricity.
Although in aggregate these regions reflect overall importing and exporting trends, the net flow of electricity for an individual balancing authority within each region may differ from the overall regional totals.
WECC is one of three electricity system interconnections, or networks, that cover the Lower 48 states. WECC consists of 34 electricity systems, or balancing authorities, that generally extend from the Rocky Mountains to the West Coast and include portions of Canada and Mexico.
In 2016, electricity generation for the US component of WECC totaled 724 billion kWh, but the system demand, or load, totalled 728 billion kWh. Mexico, Canada, and direct-current inter-ties to other US interconnections made up the net difference between total generation and demand.
System demand differs from end-use electricity consumption in that it includes a small amount of electricity lost to heat and other factors in the transmission and distribution system.
In addition, system demand is reduced by the output of distributed generation sources, such as distributed solar photovoltaic (PV) installations. California currently leads the United States in distributed PV capacity.
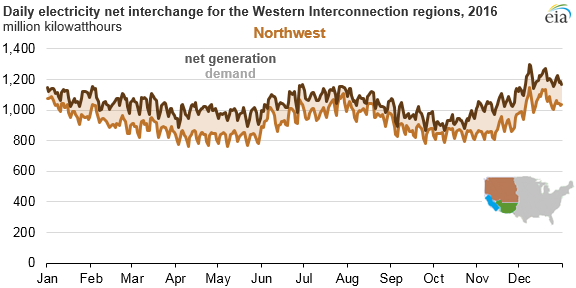
More than half (53 per cent) of WECC’s total net generation in 2016 came from the Northwest region, although that region represented less than half (46 per cent) of total demand.
The Southwest is the smallest of the three regions in WECC, making up 18 per cent of net generation and 15 per cent of system demand in 2016.
The California ISO’s net generation of 210 billion kWh accounted for 29 per cent of the total generation within the WECC in 2016, while its demand, at 283 billion kWh, accounted for 39 per cent of the regional total.
The daily peak in system demand for the California ISO and the entire Southwest occurs during the summer, driven by air-conditioning load. Conversely, the heating load drives peak demand in the Northwest, where the daily peak during 2016 was on Dec. 8.

Ph: 432-978-5096 Website: www.mapleleafmarketinginc.com
In 2016, EIA began collecting and publishing hourly electricity operating data, including actual and forecast demand, net generation, and electricity interchange between electric systems.
The survey includes data from all 66 electric system balancing authorities that make up the Lower 48 U.S. electric grid.
Source: U.S. Energy Information Administration
Subscribe
If you enjoyed this article, subscribe to receive more just like it.