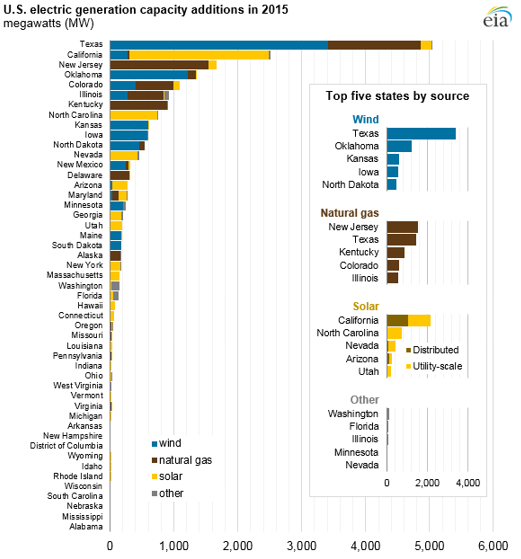
Wind adds most electric generation capacity in 2015, followed by natural gas, solar
In Texas, new wind power records continuously being set as wind fleet grows
Wind, natural gas, and solar made up almost all new electric generation capacity in 2015, accounting for 41 per cent, 30 per cent, and 26 per cent of total additions, respectively, according to the US Energy Information Administration.
The preliminary data also show a record amount of distributed solar photovoltaic (PV) capacity was added on rooftops throughout the country in 2015.
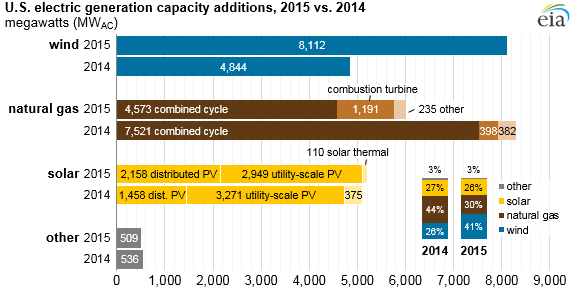
Source: U.S. Energy Information Administration, Preliminary Monthly Electric Generator Inventory
Wind – Wind installations steadily increased in 2014 and 2015 from less than 1,000 megawatts (MW) added in 2013.
Uncertainty surrounding the extensions and modifications of the federal production tax credit (PTC) over the past several years led to large fluctuations in annual wind additions.
The record amount of additions in 2012 was followed by a precipitous drop-off in 2013 and a subsequent rebound in 2014 and 2015—a pattern also visible with previous years’ PTC expiration and renewal cycles.
Texas added the most wind capacity (42 per cent of total wind additions), followed by Oklahoma, Kansas, Iowa, and North Dakota. All of these states are located in the central part of the country, where wind resources are the strongest.
In Texas, new wind power records are continuously being set as the wind fleet continues to grow.
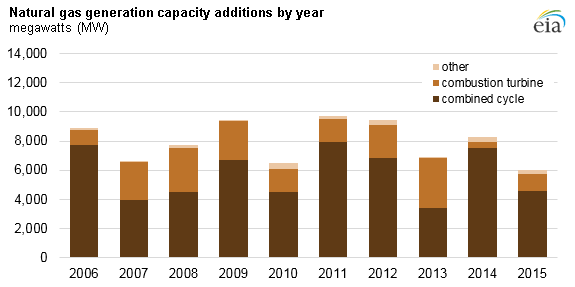
Source: U.S. Energy Information Administration, Preliminary Monthly Electric Generator Inventory Note: Data include facilities with a net summer capacity of one megawatt and above.
In New Jersey, most of the new capacity came from two combined-cycle plants, the Newark Energy Center (685 MW) and the Woodbridge Energy Center (795 MW).
Both plants will be supplied by the Transco natural gas pipeline, which recently completed expansions to bring larger volumes of Marcellus natural gas to market areas.
In Texas, the second phase of the combined-cycle Panda Temple Power Station (734 MW) and three combustion turbine plants totaling 716 MW (Ector County Energy Center, Montana Power Station, and Elk Station) came online.
Utility-scale solar – California added more than 1,000 MW each of utility-scale and distributed solar PV capacity, accounting for 42per cent of overall solar additions in 2015.
North Carolina added 720 MW of utility-scale PV, more than double the amount added in the state in the previous year.
In Nevada, the 110 MW Crescent Dunes concentrating solar thermal plant with energy storage came online in 2015 along with several solar PV plants totaling 236 MW.
Source: U.S. Energy Information Administration, Electric Power Monthly Note: All data reported in alternating-current megawatts (MWAC).
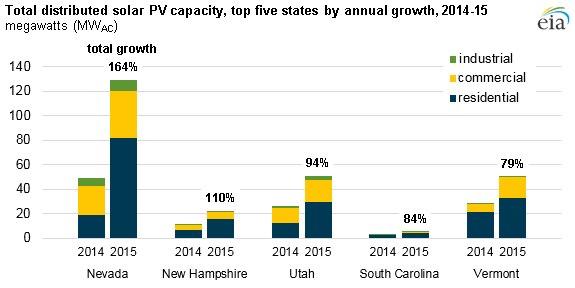
While still far behind top distributed solar PV states, several states saw notable growth in 2015, including Nevada, where distributed PV capacity more than doubled from 49 MW to 129 MW.
Further growth of Nevada’s distributed PV sector, however, is uncertain because Nevada’s Public Utility Commission recently approved several changes to the net-metering tariffs, including phasing in lower net-metering compensation rates and higher monthly fixed charges for distributed PV customers.
These changes are an effort to address concerns about grid maintenance costs being shifted disproportionately from customers with solar systems to non-solar customers.
Source: U.S. Energy Information Administration, Preliminary Monthly Electric Generator Inventory Note: Data include facilities with a net summer capacity of one megawatt and above except for solar, which also includes small-scale distributed solar photovoltaic (PV) capacity. All data reported in alternating-current megawatts (MWAC).
Subscribe
If you enjoyed this article, subscribe to receive more just like it.