Coal stockpiles at US power plants have fallen since last year
Source: U.S. Energy Information Administration, Electricity Monthly Update, coal stockpiles
57% of US coal-fired electricity generating capacity had over 60 days of burn
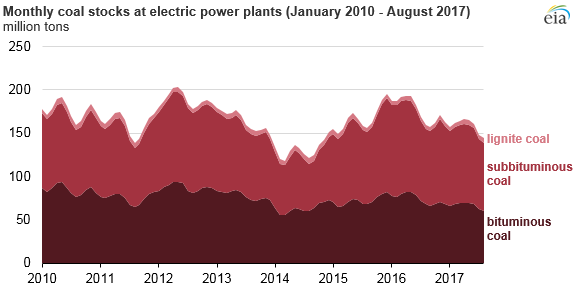
In Aug. 2017, coal stockpiles at electric power plants were 144 million tons, the lowest monthly level since late 2014, according to EIA’s Electric Power Monthly.
Coal stockpiles at U.S. coal-fired power plants typically follow a seasonal pattern of increasing during the spring and fall, when electricity demand is relatively low, and decreasing during the summer and winter, when electricity demand is relatively high. Coal stockpiles typically reach their lowest point in Aug.
Source: U.S. Energy Information Administration, Electric Power Monthly
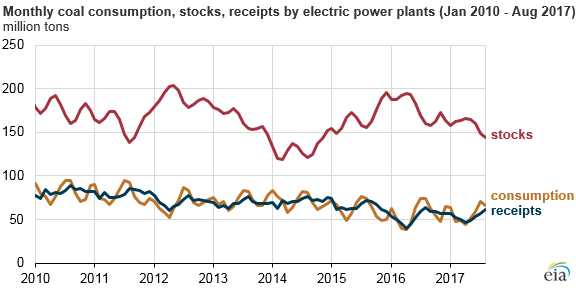
Coal plants generally stockpile much more coal than they consume in a month. Coal consumed by power plants follows the seasonal pattern in overall electricity generation, meaning coal consumption is typically highest in summer and winter months and lowest in spring and fall months.
Coal receipts at power plants fluctuate less than consumption, but they have averaged 53,000 tons in each month of 2017, slightly lower than the average monthly consumption rate of 56,000 tons, based on data through Aug.
Coal receipts are less variable than consumption because the producing mines and coal transporters (mainly railroads) generally require power plants to receive coal at a roughly constant rate during the year.

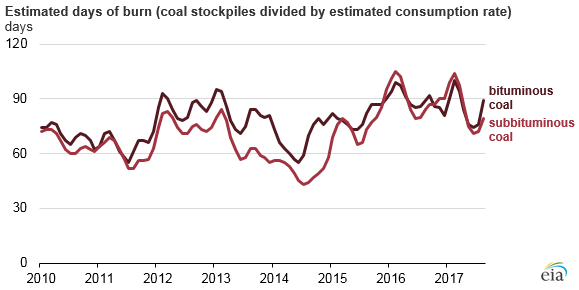
In addition to surveying coal stockpile levels, EIA also calculates how long these stockpiles would last assuming no additional coal was received.
This value, known as days of burn, considers each plant’s current stockpile level and its estimated consumption rate in coming months. EIA estimates the historical burn rate by averaging the most recent three years of historical data and applying that to the upcoming months.
Source: U.S. Energy Information Administration, Electricity Monthly Update
As of Aug. 2017, about 55 per cent of total coal stocks were subbituminous coal, most of which is produced in Wyoming.
On average, coal plants using subbituminous coal can operate about 80 days at Aug. 2017 stockpile levels.
Another 42 per cent of coal stocks are bituminous coal from states such as West Virginia, Kentucky, and Pennsylvania.
Plants using bituminous coal can operate about 90 days at Aug. 2017 stockpile levels. Individual plants may be capable of operating on much shorter or longer timelines, depending on their own stockpile levels and consumption rates.

In the Electricity Monthly Update, individual plant-level stockpile estimates are aggregated into three categories: those with more than 60 days of burn, those with 30 days to 60 days of burn, and those with less than 30 days of burn.
As of Aug. 2017, 57 per cent of U.S. coal-fired electricity generating capacity had more than 60 days of burn.
About 33 per cent of capacity had between 30 days to 60 days of burn, and the remaining 10 per cent had fewer than 30 days of burn.
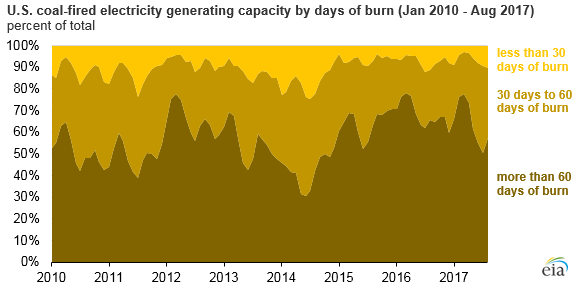
Source: U.S. Energy Information Administration, Electricity Monthly Update Note: Excludes plants using lignite coal.
Coal stockpile data for individual power plants are currently treated as confidential. At the end of 2017, EIA will release coal stockpile data by plant for 2002 to 2016, introducing a new annual data release.
Subscribe
If you enjoyed this article, subscribe to receive more just like it.