
“EPA’s new methane rules will be far more costly than proponents have let on, and it’s clear why organizations such as CAP feel the need to continue pushing misinformation to justify this rule”
By Seth Whitehead, Energy In Depth
 A new Center for American Progress report — concocted specifically in an attempt to justify methane regulations on existing oil and gas infrastructure — uses Environmental Protection Agency (EPA) Greenhouse Gas Reporting Program (GHGRP) data to single out “which companies in the onshore oil and gas production sector are responsible for the most methane emissions and which regions of the country experience the most methane pollution.”
Considering that CAP is funded by a number of anti-fracking foundations (such as the Rockefellerand Tides Foundations) it’s not surprising that the report entitled “Who’s Who of Methane Pollution in the Oil and Gas Production Sector” claims,
“… EPA data show that oil and gas wells already in operation are releasing significant volumes of methane across the United States. The best way to curb these emissions is for the EPA to set strong mandatory standards for existing sources in the oil and gas sector in order to complement the new source standards finalized in May 2016…”
But just as predictably, the report ignores the fact that the GHGRP data and numerous other reputable sources actually show methane emissions from oil and gas development are low and declining, making such regulations a solution in search of a problem. Here’s a rundown of the facts the CAP chooses to ignore in an effort to push its narrative.

Fact #1: Methane emissions from natural gas systems have declined significantly as production has skyrocketed
CAP completely ignores the fact that the EPA GHGRP – the database from which they cull all of their data – actually shows methane emissions from reporting petroleum and natural gas systemsdecreased 17 percent (58 mmt CO2 eq. to 48 mmt) from 2011 to 2014, doing so despite the fact that 67 more facilities reported to the GHGRP in 2014 than did in 2011.
Though GHGRP data only includes emissions from facilities that emit more than 25,000 metric tons of CO2 eq. per year and does not reflect total U.S. methane emissions, the EPA’s Greenhouse Gas Inventory does provide nationwide methane emissions. And even when you consider EPA’s upwardly revised data on methane emissions from its latest inventory (more on that in a bit), the fact remains that it also shows methane emissions from natural gas systems have declined significantly at the same time that production has skyrocketed. From the 2016 GHG inventory:
“Those emissions [from natural gas systems] have decreased by 30.6 MMT CO2 Eq. (14.8 percent) since 1990.” (p. ES-13; emphasis added)
The reductions are remarkable no matter what timeframe you look at in the GHGI. Natural gas production has increased over 53 percent since 1990 at the same time that methane emissions have dropped nearly 15 percent.
According to the EPA, methane emissions have also declined from 2005 (177.3 mmt CO2 eq.) to 2014 (176.1 mmt) as natural gas production increased 42 percent. And from 2010-2014, natural gas production increased 21 percent while methane emissions increased by only 6 percent.
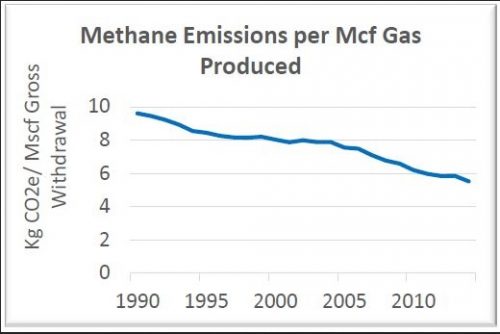
A recent ICF International report, commissioned by The Natural Gas Council (NGC), provides even more context to the rate of methane emission declines since 1990, finding a decrease of 43 percent per unit of natural gas produced, as the following graphic from the report indicates:
It’s worth pointing that EPA’s upward revisions were largely driven by the counterintuitive assumption that emissions from smaller sources were the same as larger sources. But as flawed as the new EPA estimates are, the agency’s own data still show that emissions have dropped or remained stable as production has skyrocketed – thanks entirely to voluntary actions from operators, equipment and infrastructure improvements and without costly regulations.
Fact #2: Claims certain basins are the highest emitting even though they ALL cut emissions significantly since 2011
The report highlights the top-emitting oil and gas basins, both by total emissions and million metric tons (MMT) of emissions per well, in an effort to drive home its narrative of “significant” emissions. But the report fails to note that each of the basins it focuses on saw significant declines in methane emissions from 2011 to 2014, according to EPA GHGRP data.
The San Juan Basin — which activists often single out as an egregious emitter, and the report list as the No. 3 overall emitting basin and top emitting basin based on mmt of emissions per well – has actually seen its methane emissions from GHGP-reporting facilities decrease 3.4 mmt since 2011. The oft-cited methane “hot spot” from the Four Corners region of this basin is attributable to natural methane seepage that has nothing to do with oil and natural gas development, by the way.
The Anadarko Basin, which CAP lists as the top overall emitter for 2014, has seen a 600,000 mmt reduction in methane emissions since 2011. The Gulf Coast and Permian Basins, which come in at No. 2 and 3 on CAP’s top emitting list, have both seen 400,000 mmt reductions since 2011. The Appalachian Basin, listed fourth on the overall emitting list, and Arkoma Basin, the second-largest emitter by well, have both reduced emissions by 1.4 mmt since 2011.
Fact #3: The company CAP claims is the “highest emitting” has reduced emissions 40 percent from 2013 to 2014
The CAP report, and anti-fracking activists in general, insist regulations on existing infrastructure are absolutely necessary to achieve the Obama administration’s goal of 40-45 percent reductions from 2012 levels by 2025.
But ConocoPhillips, the company that CAP singles out as the top emitter in its rankings has already achieved 40 percent reductions via voluntary measures in one year, as the CAP report andClimateWire even pointed out:
“In 2013, the company also took the top methane emitter spot, releasing 5.8 million metric tons of carbon dioxide equivalent of methane in the San Juan Basin in New Mexico, according to analysis conducted by ClimateWire last year. Since then, ConocoPhillips has cut its methane emissions by 40 percent for its onshore oil and gas production, mostly by investing in more efficient pneumatic devices and altering its liquids-unloading process, according to the report.”
In a statement to ClimateWire, ConocoPhillips noted that thanks to its voluntary efforts, less than three percent of its pneumatic devices are now high-bleed, and none of its new facilities use the higher methane emitting equipment:
“ConocoPhillips has changed how it performs well completions to reduce methane emissions and had upgraded some of its flare technology to be more efficient. The company is also monitoring for leaks using infrared technology. Over the past five years, these changes had helped reduce the company’s greenhouse gas emissions by 6.8 million tons and prevented 9 billion cubic feet of methane emissions in the contiguous United States since 2009.
“Managing natural gas emissions continues to be a key priority for our company. We work to capture even small releases of natural gas, and methane emission reduction is a crucial aspect of our well management principles.
“In addition to reducing methane emissions, the company has also installed small-scale solar systems in many locations.”
ConocoPhillips’ progress clearly shows that voluntary measures are working. But not surprisingly, CAP twists the companies’ actions to cut emissions as evidence that regulations are needed to ensure other companies follow suit:
“ConocoPhillips has shown that companies can use existing technology to reduce their methane pollution at wells that are already in operation. More remains to be done; however: The company remains the top methane emitter in the San Juan Basin of Colorado and New Mexico… Voluntary measures alone are not sufficient to drive across-the-board methane emissions reductions and ensure that all companies are detecting and repairing methane leaks in a timely manner on both public and private lands.” (emphasis added)
The bottom line is that a one-size-fits-all approach from EPA does not make financial or practical sense for many smaller companies and facilities that are relatively low methane emitters, as a recent ICF report illustrates.
Fact #4: Suggests “super-emitters” may be driving up emissions, even though EDF studies show otherwise
Not surprisingly, CAP plays the tried and true “super-emitter” card to suggest emissions may be far greater than anybody realizes:
“Some of the oil and gas wells may be so-called superemitters and far leakier than regulators or even the well owners themselves know. The Environmental Defense Fund, or EDF, hired a leak detection company to fly a helicopter over 8,000 well pads across seven states and use an infrared camera to detect methane leaks. In April 2016, the EDF released its study of this experiment and revealed that experts found superemitter sites in every basin they examined. The EDF also concluded that “superemitting sources are nearly impossible to predict. They can happen anywhere anytime as a result of malfunctioning equipment that goes unattended and sloppy mistakes in the field.”

But CAP fails to note that the EDF study found “super-emitters” at just four percent of the 8,000 wellpads, illustrating that the problem isn’t as “widespread” as proponents of methane emissions are letting on.
Furthermore, EDF has noted before that its recent papers have been “biased toward high-emitters.” Yet a recent EDF analysis of 12 of its methane studies found that emissions are still very low – well below the threshold (3.2 percent of production) for natural gas to retain its climate benefits:
“Measured oil and gas methane emissions are 90% larger than estimates based on the US Environmental Protection Agency’s Greenhouse Gas Inventory and correspond to 1.5% of natural gas production.”
Fact #5: Report inadvertently highlights how exaggerated EPA’s Greenhouse Gas Inventory likely is.
The CAP report notes that the data presented in its report – which was based exclusively on GHGRP data – “likely underestimates the amount of methane released by the onshore oil and gas production sector in 2014” and that:
“Only the largest emitters of methane and other greenhouse gases—those emitting more than 25,000 metric tons of CO2e in the reporting year—report to the GHGRP. As a result, these data may not include methane emissions from smaller producers.”
But considering the report indicates the “largest emitters” reported a total of 48 mmt of CO2 eq. methane emissions in 2014 inadvertently highlights how exaggerated EPA’s revised methane emissions estimates for natural gas and petroleum systems really are.
EPA’s Greenhouse Gas Inventory claims natural gas and petroleum systems were responsible for 244.2 mmt CO2 eq. of methane in 2014. So considering larger sources were responsible for 48 mmt of that total, it appears EPA is attributing 196.2 mmt of emissions (80 percent of emissions) to smaller facilities!
We already know that EPA basically extrapolated data from large facilities reported on subpart W of the GHGRP onto smaller facilities for which it did not have solid data. This is obviously not a sound method to calculate emissions, resulting in a significant overestimation of emissions.
Conclusion
Study after study has shown that methane emissions from oil and natural gas production are exceedingly low and continuing to plummet. EID calculations also show that President Obama’s broader methane mitigation strategy – which includes the EPA’s methane rule – would yield only 0.0047 degrees Celsius of avoided warming the end of the century.
Furthermore, data from the latest EPA Greenhouse Gas Inventory show that the United States has reduced its CO2 emissions by 9 percent since 2005, largely due to “increased natural gas consumption and other generation sources.”
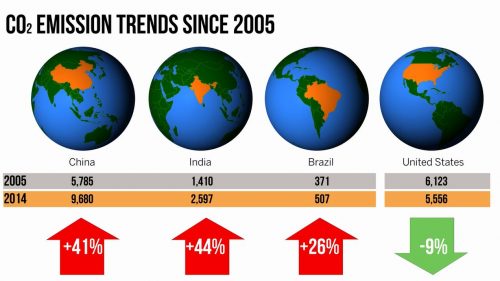
Fact is, the U.S. is the only country in the world that has significantly reduced greenhouse gas emissions, and has done so without ratifying the Kyoto Protocol or adopting cap-and-trade.
Even the Intergovernmental Panel on Climate Change (IPCC) notes that fracking is the reason for these reductions in its Fifth Assessment Report:
“[T]he rapid deployment of hydraulic fracturing and horizontal-drilling technologies, which has increased and diversified the gas supply…is an important reason for a reduction of GHG emissions in the United States.”
Throw in the fact that EPA’s new methane rules will be far more costly than proponents have let on, and it’s clear why organizations such as CAP feel the need to continue pushing misinformation to justify this rule.
Originally published June 21, 2016 at EnergyInDepth.
,