US energy-related CO2 emissions fell 1.7% in 2016 thanks to less coal
Source: U.S. Energy Information Administration, Monthly Energy Review, energy-related
CO2 emissions from electric power sector fell 4.9% in 2016
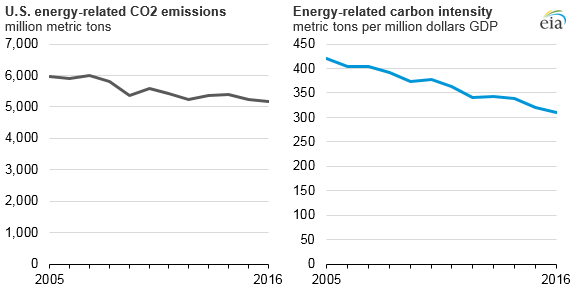
US energy-related carbon dioxide (CO2) emissions in 2016 totaled 5,170 million metric tons (MMmt), 1.7 per cent below their 2015 levels, after dropping 2.7 per cent between 2014 and 2015, according to the US Energy Information Administration.
These recent decreases are consistent with a decade-long trend, with energy-related CO2 emissions 14 per cent below the 2005 level in 2016.
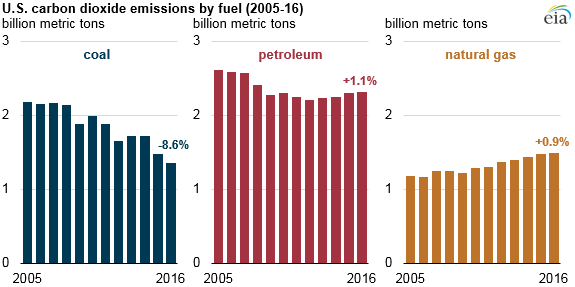
As noted in a recent article on energy use, both oil and natural gas consumption were higher in 2016 than in 2015, while coal consumption was significantly lower.

Ph: 432-978-5096 Website: www.mapleleafmarketinginc.com
Consistent with changes in fuel consumption, energy-related CO2 emissions in 2016 from petroleum and natural gas increased 1.1 per cent and 0.9 per cent, respectively, while coal-related emissions decreased 8.6 per cent.
Source: U.S. Energy Information Administration, Monthly Energy Review
There are several ways to assess CO2 emissions trends within the context of measures of economic activity.
Carbon intensity is a measure that relates CO2 emissions to economic output.
Early estimates indicate that gross domestic product (GDP) grew at a rate of 1.6 per cent in 2016, down from 2.6 per cent in 2015.
Taken together with a 1.7 per cent decline in energy-related CO2, the 1.6 per cent estimate of economic growth implies a 3.3 per cent decline in the carbon intensity of the US economy.
In 2015, carbon intensity of the economy had decreased by 5.3 per cent.
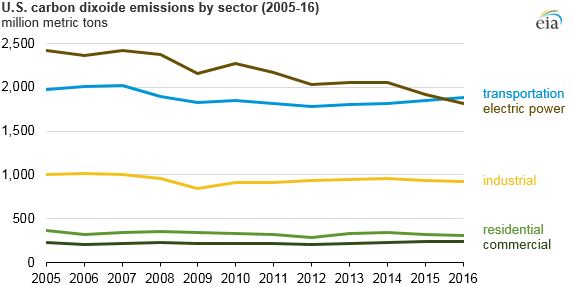
The US transportation sector was the only consumption sector where CO2 emissions increased in 2016.
CO2 emissions from the transportation sector increased by 1.9 per cent, largely reflecting emissions from motor gasoline, which increased 1.8 per cent in 2016.
Emissions from the transportation sector surpassed those from the power sector during 2016—a trend that persists through at least 2040 in the Reference case projections in EIA’s 2017 Annual Energy Outlook.
Source: U.S. Energy Information Administration, Monthly Energy Review
CO2 emissions from the electric power sector fell by 4.9 per cent in 2016.
A significant reduction in coal use for electricity generation was offset by increased generation from natural gas and renewable sources.
Renewables do not emit CO2, and a shift towards natural gas from coal lowers CO2 because natural gas has lower emissions per unit of energy than coal and because natural gas generators typically use less energy than coal plants to generate each kilowatthour of electricity.

Overall, the data indicate about a 5 per cent decline in the carbon intensity of the power sector, a rate that was also realized in 2015.
Since 1973, no two consecutive years have seen a decline of this magnitude, and only one other year (2009) has seen a similar decline.
Weather also affected the level of energy use and CO2 emissions in 2016.
Because more energy is used for heating than for cooling, warm years can translate to less energy consumption if increased cooling needs during warm summers are less than the reduced heating needs during warm winters.
Based on preliminary data, 2016 is expected to have had 10 per cent fewer heating degree days (indicating lower heating demand) and 13 per cent more cooling degree days (indicating more cooling demand) than normal.
Heating degree days in 2016 were the second fewest of any year since at least 1949, consistent with relatively warmer winter months.
Subscribe
If you enjoyed this article, subscribe to receive more just like it.